City studies changing Boston demographics
Population increases present challenges

After a dramatic 30 percent drop between 1950 and 1980, Boston’s population is on the rise, outpacing national growth in the past five years. The Hub has gained more than 100,000 residents since 1980, and projections indicate another 50,000 by the year 2030.
On the web
Imagine Boston 2030: imagine.boston.gov
“Guiding Growth: Towards an Inclusive City” report: imagine.boston.gov/growth/
Yet household sizes are shrinking: More people live alone; the percentage of families has dropped, as well as families headed by married couples; in 2015, only 30 percent of Boston households contained more than two people, compared with 49 percent in 1960.
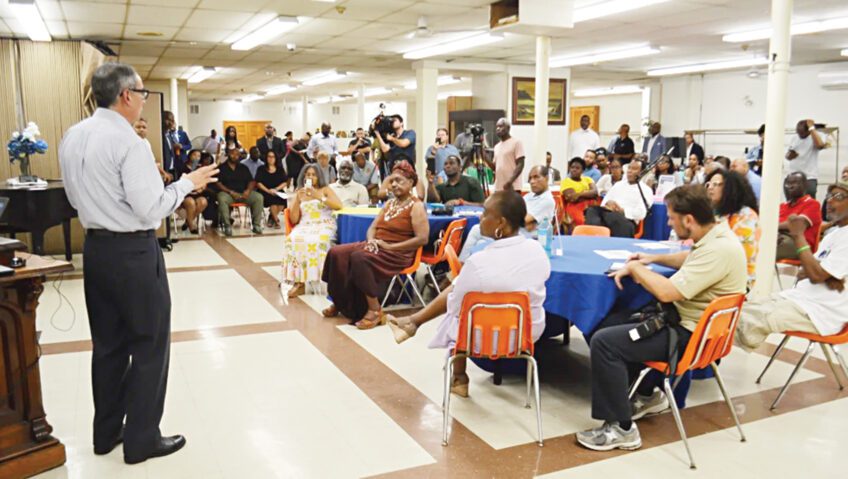
These were some of the population trends presented last month in the kick-off of a new “Boston by the Numbers” program series. Hosted by Imagine Boston 2030 and the Boston Planning and Development Agency’s research division, the series is an opportunity for Bostonians to see and discuss the data and trends that help guide long-range city planning.
The first session, held Oct. 26 at Roxbury’s BCYF Shelburne Community Center, focused on population data. Alvaro Lima, BPDA’s director of research, presented dozens of slides illustrating population numbers and demographics, from historic trends to projections for the future.
Lima explained that from 1980 to 2000, Boston’s population growth was fueled entirely by an increase in foreign-born residents, while in the 21st century the city’s foreign-born and U.S.-born populations both have risen.
The city has seen also a shift in newcomer origins. Back in 1970, the majority of foreign-born residents had come from Europe. Since then, increasing shares of immigrants come from the Americas, Asia and Africa. As of 2015, 28 percent of Boston residents were foreign-born, with the top four countries of origin being China, the Dominican Republic, Haiti and Cape Verde.
By the numbers
100,000 Boston has gained more than 100,000 residents since 1980. Projections indicate another 50,000 by the year 2030.
30 percent: In 2015, only 30 percent of Boston households contained more than two people, compared with 49 percent in 1960.
28 percent: As of 2015, 28 percent of Boston residents were foreign-born, with the top four countries of origin being China, the Dominican Republic, Haiti and Cape Verde.
723,500 The BPDA’s population models, factoring in projected births, deaths, in-migration and out-migration, predict that in 2030, the population will reach 723,500.
In terms of the city’s racial and ethnic makeup, proportions have changed dramatically over the past several decades. In 1970, the city was 80 percent white, about 16 percent black, less than 3 percent Latino and less than 2 percent Asian. By 2010, the city had flipped to solidly “majority-minority,” where whites had dropped to 47 percent of the population while blacks made up 22 percent, Latinos 17.5 percent and Asians 9 percent.
The BPDA data showed how racial and ethnic groups are concentrated geographically. The black/African American population in 1970 predominantly lived in Roxbury and in neighboring parts of Dorchester and Mattapan; in 2010 the black population was still concentrated, but had increased throughout Dorchester, Mattapan and Hyde Park. Latinos barely register on the map in 1970, but today are concentrated largely in East Boston and Jamaica Plain.
In 2015, the total city population stood at 667,137. The BPDA’s population models, factoring in projected births, deaths, in-migration and out-migration, predict that in 2030, the population will reach 723,500. This estimate falls between predictions by the Metropolitan Area Planning Council (709,500) and the UMass Donahue Institute (752,000).
Lima discussed some of the implications of a decreasing percentage of family households.
“We have smaller and smaller households,” Lima said, “and that has a huge impact for the kind of housing we build.”
Household size, however, still varies by neighborhood, with Dorchester, Mattapan, East Boston and Hyde Park having household sizes above the city average, and other areas such as Back Bay, Beacon Hill and Fenway falling below the average.
One graph depicting “net migration” showed that from 2007–2014, there was a large annual migration into the city of people ages 17–24, but an out-migration of all other age groups.
Unlike in some small towns where the majority of residents might tend to be born there, grow up, stay, and die there, Boston’s population bulge of college students and young adults makes it difficult to plan ahead for housing, schools and transportation, Lima noted.
“When you [first] have kids, you can be in a small house, but when you have two kids, maybe you move to a city outside Boston,” he said. “It’s very complicated, because you have to make assumptions on how people will behave in the future.”
Before the presentation, Imagine Boston 2030 community engagement staff led a few attendees through an exercise in city planning, using Lego bricks to represent the placement of housing, climate change adaptation measures and public spaces on a blank coastal “city,” bringing home in a small way the many tradeoffs faced in balancing multiple needs and limited space.
Though this first session drew only a handful of attendees, organizers hope to engage more residents and spark discussions as the Boston by the Numbers series continues through the fall and winter.
Upcoming sessions, with data topics still to be announced, are as follows: Nov. 17 at Mattapan Health Center; Dec. 12 at District Hall, Seaport District; Jan. 19 at Boston Public Library, Copley; Feb. 15 at Josiah Quincy School, Chinatown. All sessions are scheduled for 6:30–8 pm. In addition, one session will be in East Boston, with date and location to be determined.