New data show more diverse Boston
Latino population grows in latest American Community Survey data
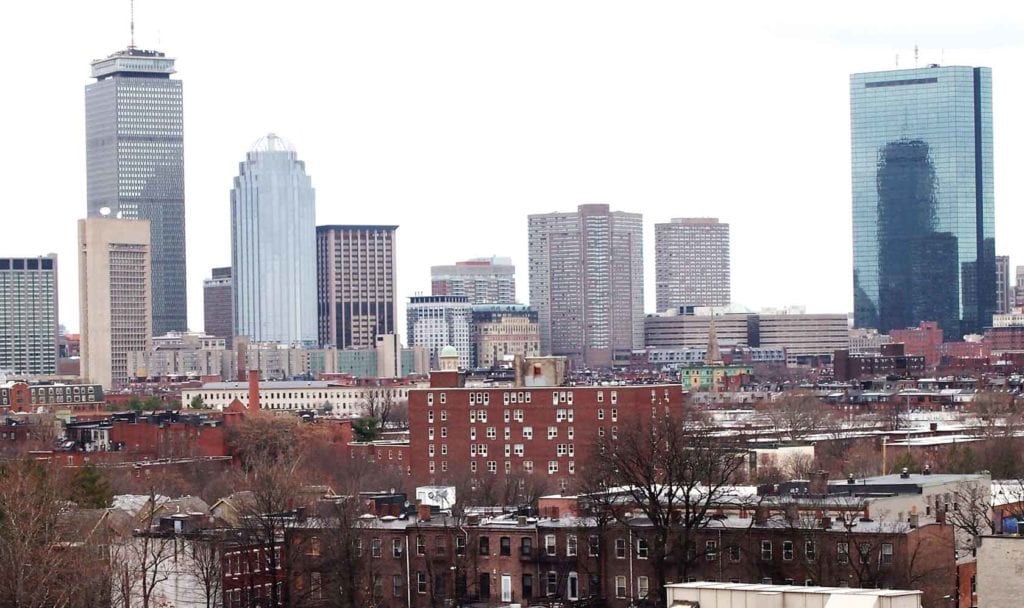
The city of Boston’s population has continued to grow and become more diverse over the past seven years, according to a report by the Boston Planning and Development Agency released last month.
The report, titled “Boston in Context,” includes demographic trends from around the city’s neighborhoods between 2013 and 2017, based on the American Community Survey. The BPDA also released a report with an overview of the data from the entire city between 2010 and 2017.
While the neighborhood boundaries used in the report do not necessarily match up with local points of view, as they are based on a combination of census tracts, zip codes and zoning districts, the resulting data paint a picture of a constantly changing city.
Population on the rise
The population of the city has risen from 621,383 in 2010 to 669,158, and the median age has risen to 32, up from 30.5 in 2010. The neighborhood with by far the highest population is Dorchester, with 125,947; this is more than twice the population of the second-highest neighborhood, Roxbury, with 52,944 residents.
Not including the small, 322-resident population of the Harbor Islands, West Roxbury has the highest median age at 43. Longwood has the lowest, at just 20.
Diversity in Boston
The majority of Boston residents are people of color, with 44.9 percent non-Hispanic white. Of the rest, 23.1 percent are black (compared with just 6.7 percent statewide), 20.4 percent are Hispanic or Latino, 9.7 percent are Asian and 2.8 percent are other or multiple races.
The white population has decreased since 2010, when it was 47.6 percent, while the Latino and Asian populations both have increased. The black population has remained fairly steady.
Mattapan has the highest percentage of black residents, at 73 percent. Meanwhile, some of the city’s oldest neighborhoods, the North End and Beacon Hill, have the lowest percentages of black residents, at 0.5 percent and 1.3 percent, respectively. (The North End has just 45 black residents out of 9,271, while Beacon Hill has 123 out of 9,751.) The Seaport district has the next-lowest, at 2.7 percent, or 94, black residents.
Boston has also become home to more non-native-born Americans. The native-born population fell from 73.1 percent to 70.7 percent. However, according to the report, “There was no significant change in the regions of the world from which immigrants came to Boston,” which include the Caribbean at 29.1 percent of foreign-born residents, Asia at 26 percent and Europe at 12.6 percent.
The percentage of households where a language other than English is spoken increased from 35.5 percent to 38.5 percent, with Spanish being the most common, rising from 14.9 percent to 17.1 percent. Residents with limited English proficiency also rose to 18.6 percent from 17.1 percent.
Housing and income
The majority of Boston housing units are occupied by renters, at 64.8 percent. This has fallen since 2010 from 67.5 percent, while about 15,000 units of housing were built in the city.
The average household size in Boston is 2.37, with 52 percent family households and 48 percent non-family households.
Monthly rent increased to $1,541 from $1,386 (in 2017 dollars) since 2010. At the same time, median household income increased from $56,085 (2017 dollars) to $66,758. The neighborhoods with the highest family income include Beacon Hill, Back Bay, the West End and the Seaport, all of which have a majority of residents making $150,000 or more per year.
The lowest per-capita income in the city is Longwood with $7,033; the highest is the Seaport at $99,073.
Poverty rates have decreased in Boston since 2010, falling from 23.3 percent to 18.7 percent. Other than the Harbor Islands, the neighborhoods with the highest poverty rates include Fenway (40.8 percent), Mission Hill (40.4 percent), Roxbury (33.9 percent) and Allston (31.1 percent).
The percentage of residents age 25 and older with a graduate or professional degree increased by two percentage points to 22.3 since 2010, while the percentage of individuals that age with a high school education or less decreased to 33.4. Other than the Harbor Islands, the neighborhood with the lowest percentage of residents with a bachelor’s degree or more is Mattapan at just 16.8 percent; the neighborhood with the highest is Beacon Hill at 89.8 percent.
The most common occupation for the civilian employed population 16 years and older is sales and office occupations, at 20.1 percent, followed by management, business and financial occupations at 19.6 percent.


