Immigration and the rising cost of housing have helped drive dramatic demographic changes in Boston and the surrounding area since 1990, according to “Changing Faces of Greater Boston,” a report released by The Boston Foundation last week.
While the percentage of blacks in the city of Boston has held steady at 23 percent over the last quarter-century, the number of blacks has increased dramatically in the Greater Boston region, from 215,193 in 1990 to 340,318 in 2016 as the area’s overall population has increased by 530,000, according to data from the American Community Survey.
At the same time, the city’s urban core has seen a nearly 10 percent decrease of blacks, Latinos and Asians living in Chinatown and parts of the South End, Jamaica Plain and Roxbury, a drop the report authors attribute to rapidly rising housing costs. The percentage of whites in Boston has dropped from 59 in 1990 to 44 percent in 2016 as the percentages of Latinos and Asians have climbed, but there has been movement of people of color away from the center of the city to its margins — neighborhoods including Dorchester, Mattapan, Hyde Park and East Boston.
That movement toward the outskirts is mirrored in the even more dramatic growth of black, Latino and Asians populations in the wider region, which has seen a net increase in nearly 480,000 foreign-born people of color and 48,000 U.S.-born people of color, along with a net decrease of 347,407 whites.
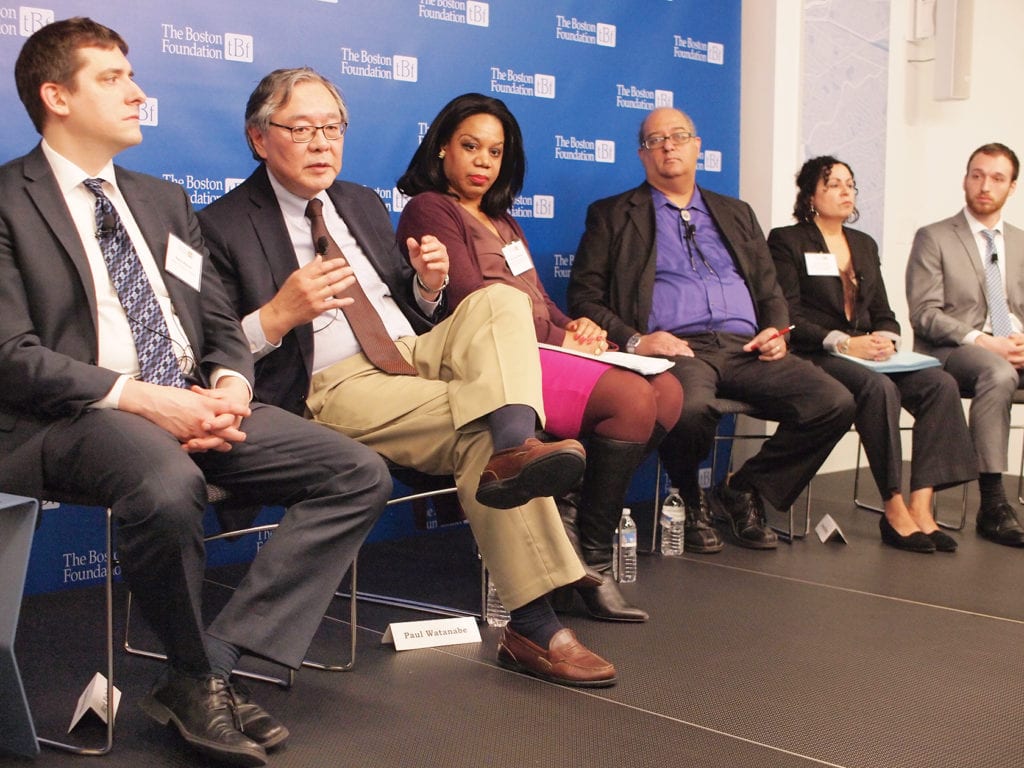
“White deaths outnumber white births,” said Luc Schuster, director of the Boston Foundation’s Indicators Project during a presentation of the nonprofit’s data last week.
Black population shifts
Within the region, Brockton saw the greatest influx of blacks, and accounted for 18 percent of all home loans to blacks in the state. With the average single-family home in Roxbury costing more than twice that in Brockton, many black families have moved south of the city to towns including Brockton, Milton, Stoughton and Randolph.
The increases in those towns has been driven largely by an influx of foreign-born blacks, nearly half of whom have arrived from Haiti. After the 47,961 Haitian immigrants, the majority of black immigrants hail from Africa — Cape Verde, Nigeria, Kenya, Uganda, Somalia and Ethiopia — and the Caribbean island nations of Jamaica, Trinidad and Tobago and Barbados.
Roxbury, a neighborhood that for a half-century has been majority black, remains just barely so, with African Americans making up 52 percent of the population, down from 79 percent in 1990. Latinos’ share of the neighborhood’s population grew from 14 percent to 29 percent. Whites in Roxbury increased from 3.6 percent in 1990 to 12 percent in 2016.
In the same time period, Brockton went from a population that was 77.5 percent white to 39.6 percent white. African Americans now represent 39 percent of the population there. Much of that increase came from African and Caribbean immigrants, with Cape Verdeans making up 37 percent of the black population there and Haitians 27 percent.
While Boston still has the region’s largest black population in terms of numbers, Randolph and Brockton have higher percentages of blacks — 38 and 39 percent, respectively.
The Boston Foundation report drilled down to Boston’s neighborhood level, finding that Hyde Park has undergone one of the most dramatic demographic shifts, with African Americans more than doubling their share of the population there, from 22 percent in 1990 to 46 percent in 2016. At the same time, Latinos increased from 5 percent to 29 percent. The white share of Hyde Park’s population dropped from nearly three-quarters in 1990 to just 25.6 percent in 2016.
Latino population
Much of the dramatic increase in the region’s Latino population has been driven by immigration from the Dominican Republic and Central and South American countries such as El Salvador, Colombia and Guatemala.
Gaston Institute Executive Director Lorna Rivera noted that much of the increased immigration from Central and South American countries came after U.S. intervention into political conflicts in the region during the 1980s.
“Our interventions contributed to civil wars that led to economic disruptions,” she said during the presentation at the Boston Foundation last week.
While Puerto Ricans are the largest Latino subgroup in Massachusetts, followed by Dominicans, the East Boston neighborhood is home to more Central and South Americans, with Salvadorans, Colombians and Guatemalans the largest groups.
Rising housing costs spur shifts
The report’s authors caution that Boston’s increased diversity could be under threat from the rising cost of housing.
Although East Boston has seen a dramatic rise in its Latino population — from 17 percent in 1990 to 54 percent in 2016 — Rivera noted that that neighborhood now may be beginning to lose some of those numbers to gentrification. School enrollment in East Boston has dropped as housing prices there have soared.
“While much of the growing diversity in outlying cities and towns may be due to immigration from abroad, there is ample evidence that the limited availability of affordable housing in the urban core is also pushing all kinds of families away from neighborhoods where they otherwise may prefer to live,” the report reads. “Among them are many who settled in Boston as migrants fleeing poverty, violence or repression who may once again feel pressure — this time from tightening economic screws — to leave a community they call home.”
Asian American population
Asian Americans were the fastest-growing demographic in the Greater Boston region. Following the pattern of economic displacement from inner-city neighborhoods, their numbers increased dramatically outside of Chinatown, where Census data shows recent homebuyers now have an average income of $373,000. More than 26,000 Asians live in the city of Quincy, where they make up 28 percent of the population, and more than 13,000 in the heavily Vietnamese Fields Corner neighborhood of Dorchester, where they account for 22 percent of the population.
Native American population
The report found the state’s Native American population has decreased since 2000, from 15,292 to 12,931 while the number of people identifying as Native American in combination with other races increased from 38,897 to 49,405. There are 5,914 Native American people living in the Greater Boston area, with higher numbers living in the South Coast, Cape and islands.


