Leventhal Map Center Exhibition explores data manipulation
“BENDING LINES: Maps and Data from Deception to Distortion”

The Boston Public Library’s Leventhal Map and Education Center exhibition “BENDING LINES: Maps and Data from Deception to Distortion” presents a timely analysis of data manipulation over the past 500 years. When statistics are thrown left and right across all online platforms, identifying how data manipulation influences public opinion is a crucial lesson in today’s world.
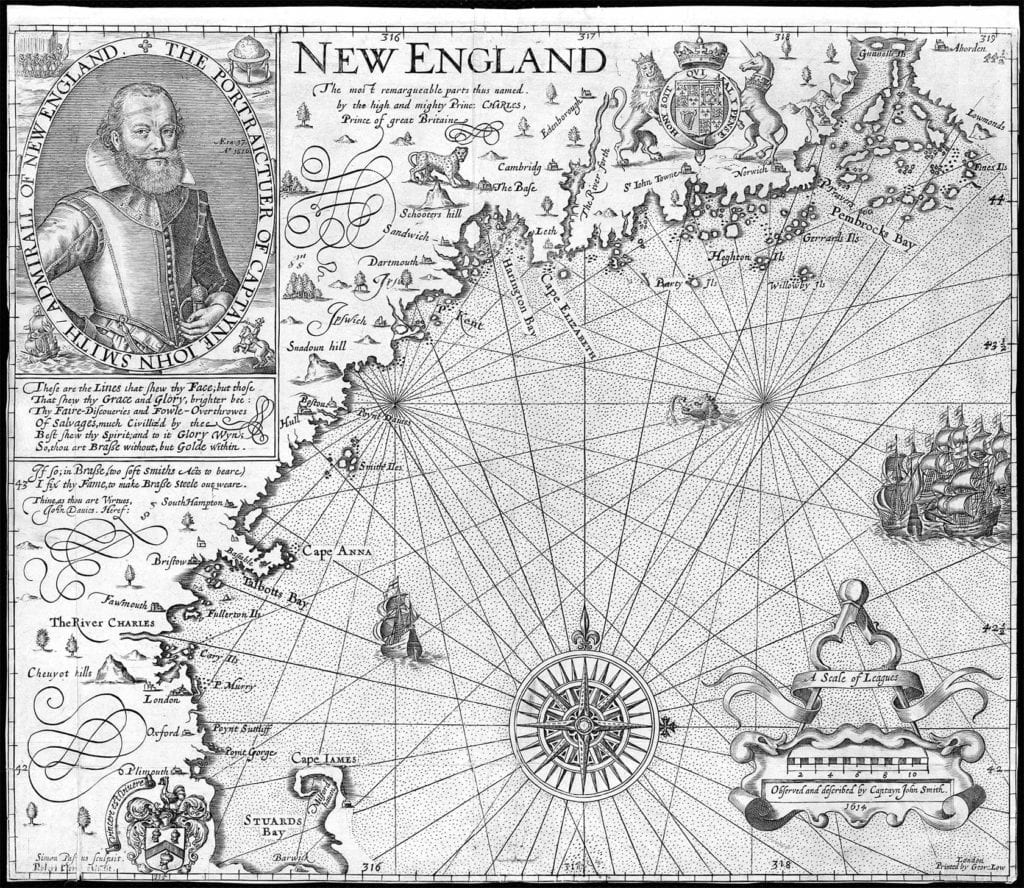
The digital exhibition, currently experienced on the Leventhal Map Center website and to be staged at the central Boston Public Library when it reopens, explores examples of ways maps have presented a distorted view of the world, what the mapmakers’ motivations may be and how those maps then influence public opinion.
In an ongoing weekly lecture series around the show, Garrett Nelson, curator of maps and director of geographic scholarship at the center, ties the show in with the current protests for racial justice. “We think a lot at the map center about the way that maps, data, visualizations of geography, have both shown and reinforced the patterns of segregation, inequality, injustice that characterize American history,” says Nelson.
He refers to the book “Fitzgerald: Geography of Revolution” by William Bunge, in which Bunge worked with black activists in Detroit to represent the causes of racial unrest and injustice in the city during the 1960s and ’70s. Nelson says, “That had led up to militarized confrontations between the state and its own citizens that are not very dissimilar to the ones that we’re seeing today.”
Some of the mapmakers’ motivations are less sinister — for example, maps that are used for advertising to targeted demographics and neighborhoods. But the ability to control public opinion is a tool frequently used irresponsibly. Maps and data are used to monitor things like the spread of disease, including our current pandemic, and to enforce unfair voting restrictions, particularly among communities of color. The exhibition is coming at an ideal time, as all of these events converge in the United States at once.
It is more important than ever to be able to look objectively at presented information and understand what biases or perspectives may have influenced the way the data looks. When information is taken at face value, the effects can be extremely dangerous.
Every week, Nelson dives into the material with another expert, often reacting to current events and their connection with the exhibition in real time. These lectures stream on Facebook Live every Wednesday at 1 pm. The exhibition will run online and later in person for a year, and additional material and activities will be added along the way.


